I've reduced my involvement in Reddit ever since they effectively shut off API access to most third party apps. They ran another r/place in July 2023, but I didn't feel like participating. Plus, they never addressed the problems with the officially-released 2022 data and I don't feel like putting in a bunch of extra effort to something that's not really going to be supported well on a site I'm moving away from.
So there's stuff below from r/place 2017 and r/place 2022, but that's it.
Visualizations
- Place Zoom 2022 lets you look around and zoom into the r/place canvas. There are a couple of visualization layers, and you can look at the canvas's state at various points of time during the event.
- Place Zoom 2017 is the same thing, but for the 2017 data.
- User Stats 2017 lets you look up a Reddit username and see where that person placed their pixels and whether any of those pixels were in the final canvas.
- I haven't built a pixel-placement visualization for 2022 yet, but if you want that, you can check out u/kisielo85's pixel finder.
Images
Over time, I've made a few images derived from the Place data.
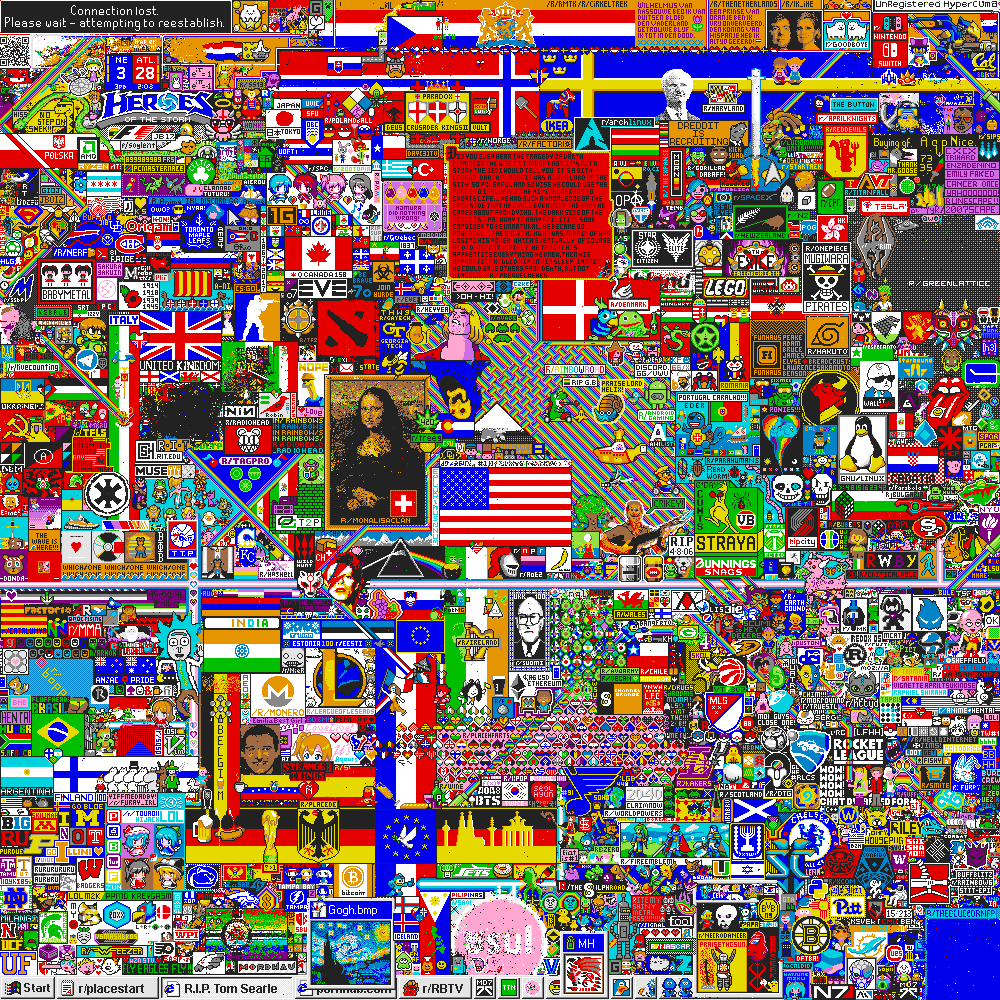
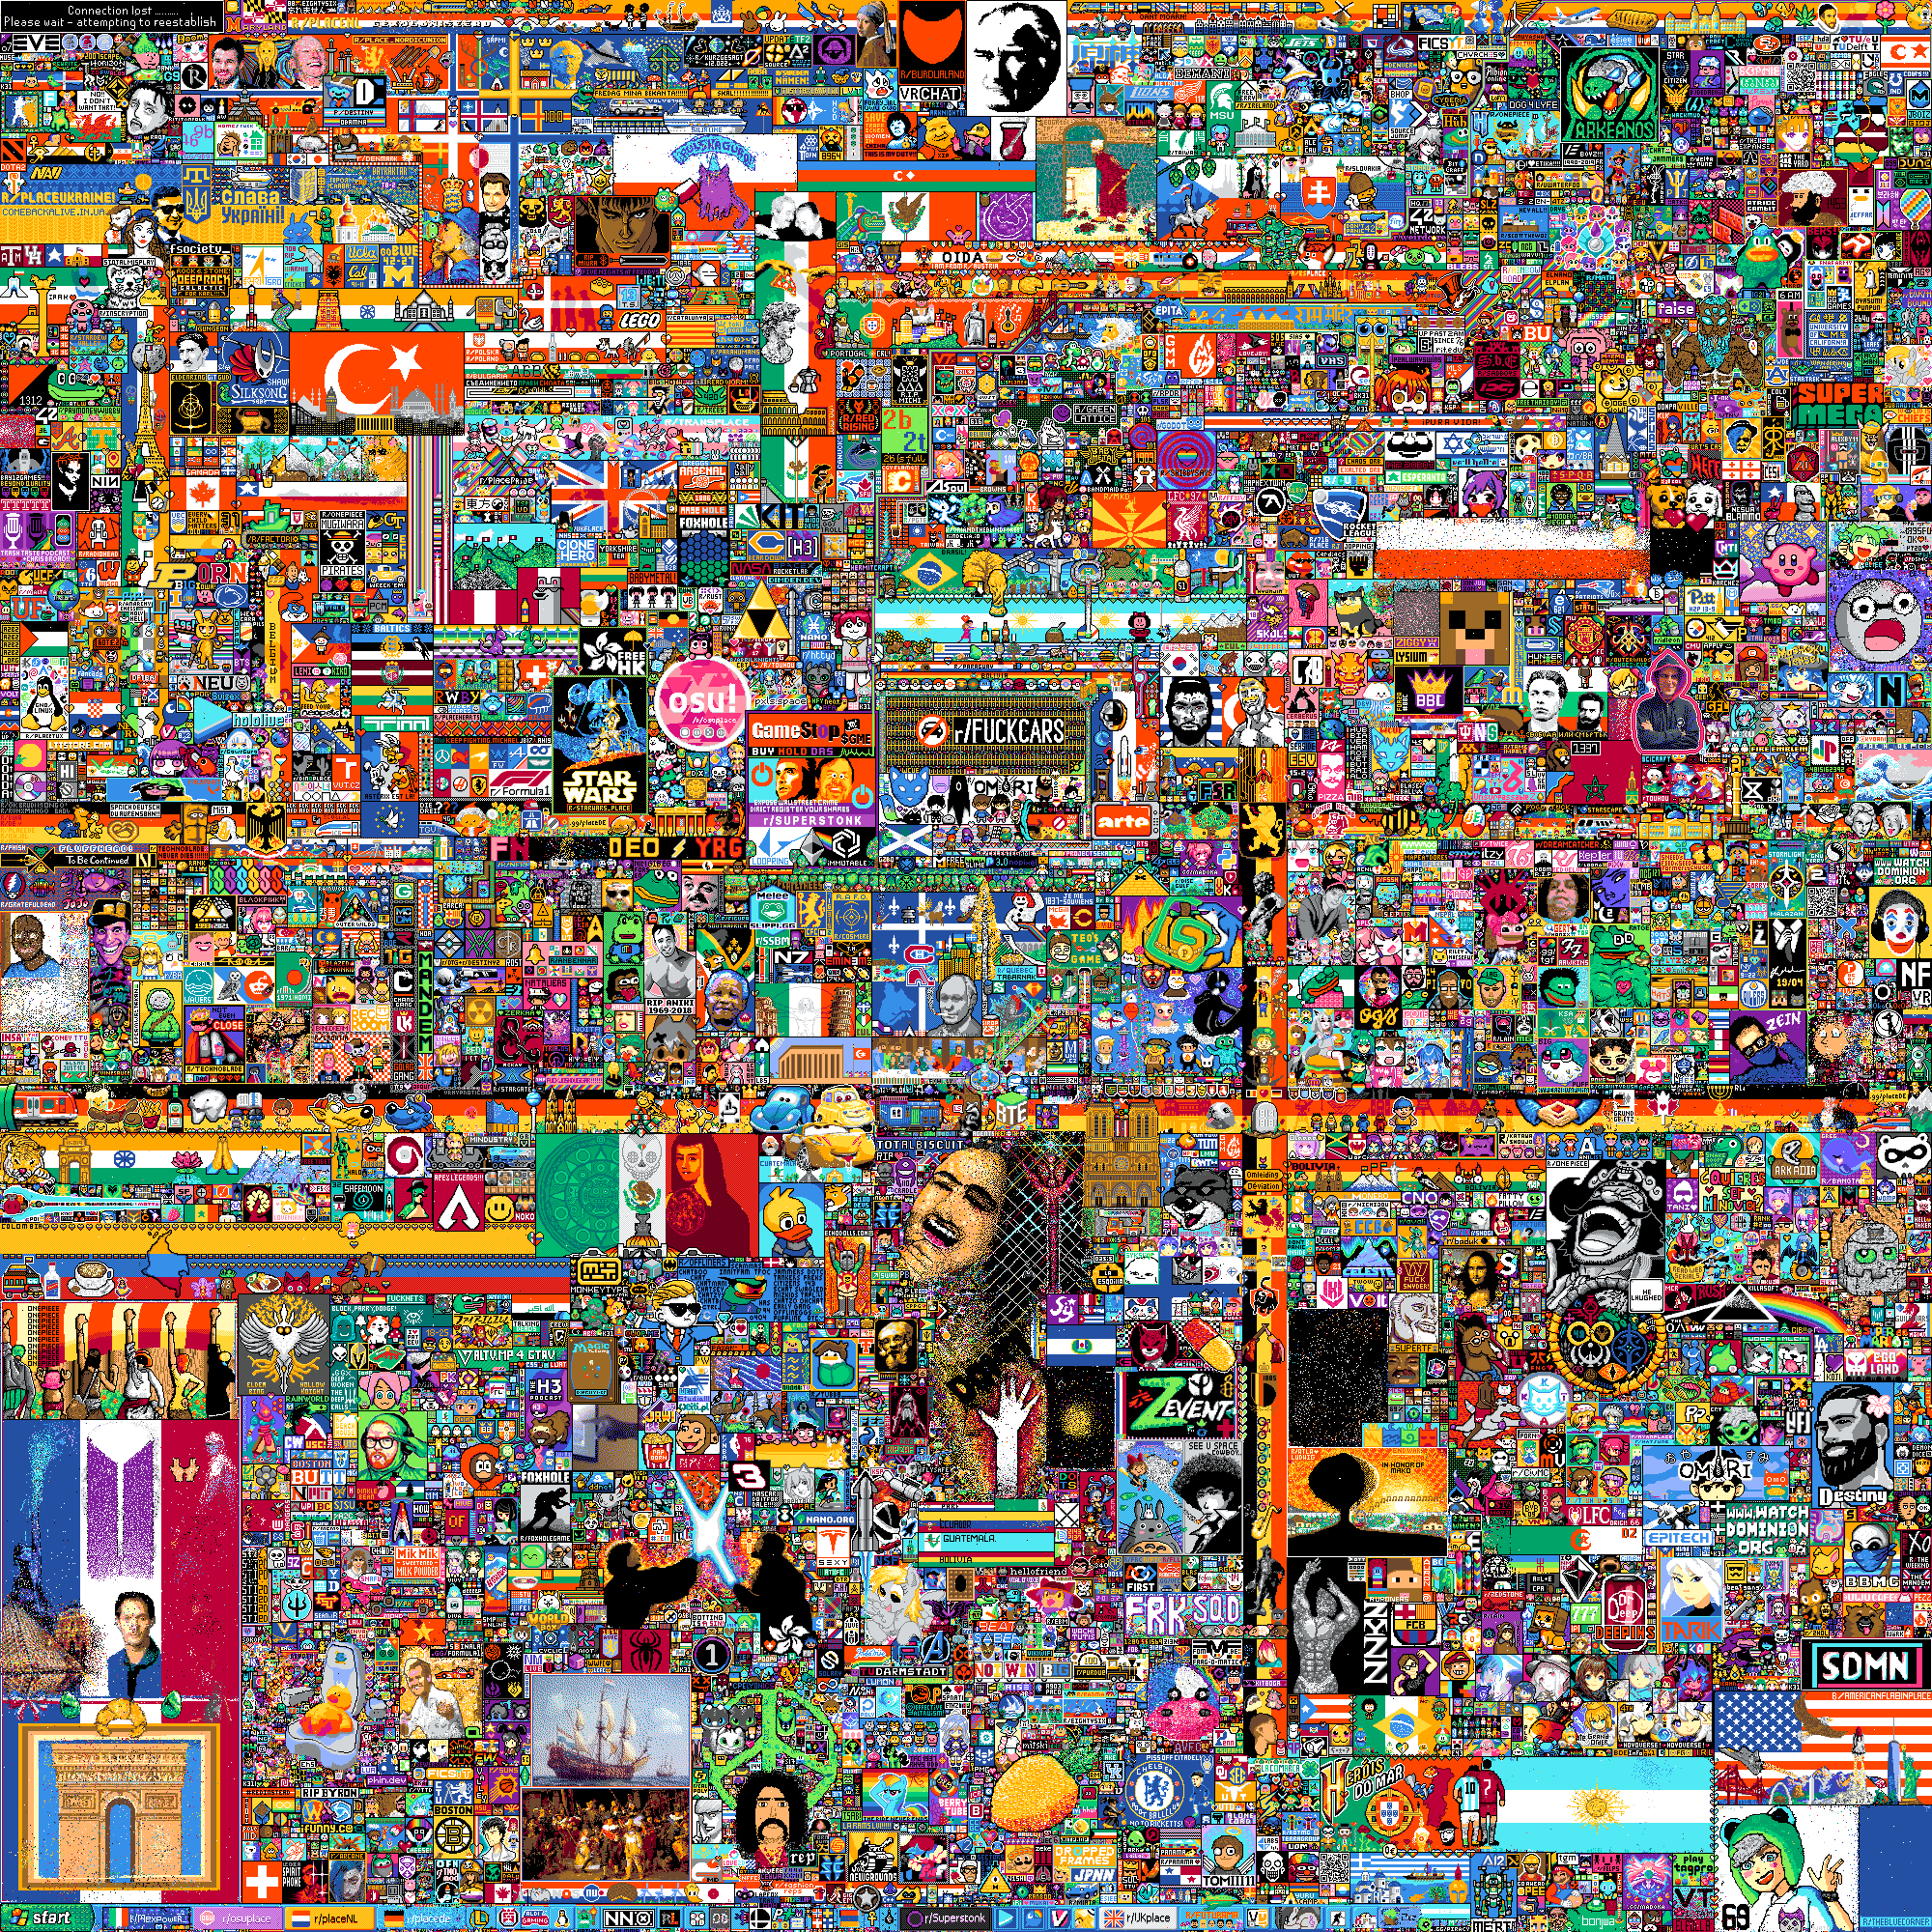
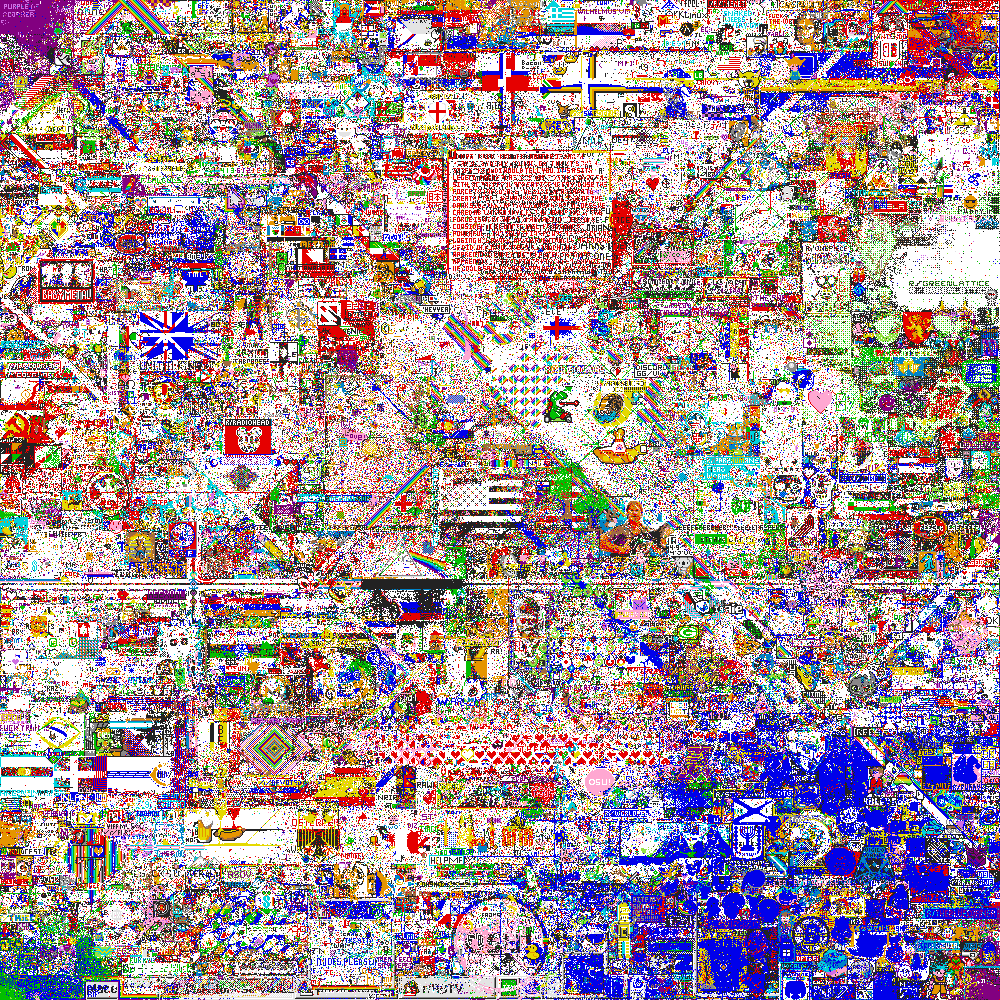
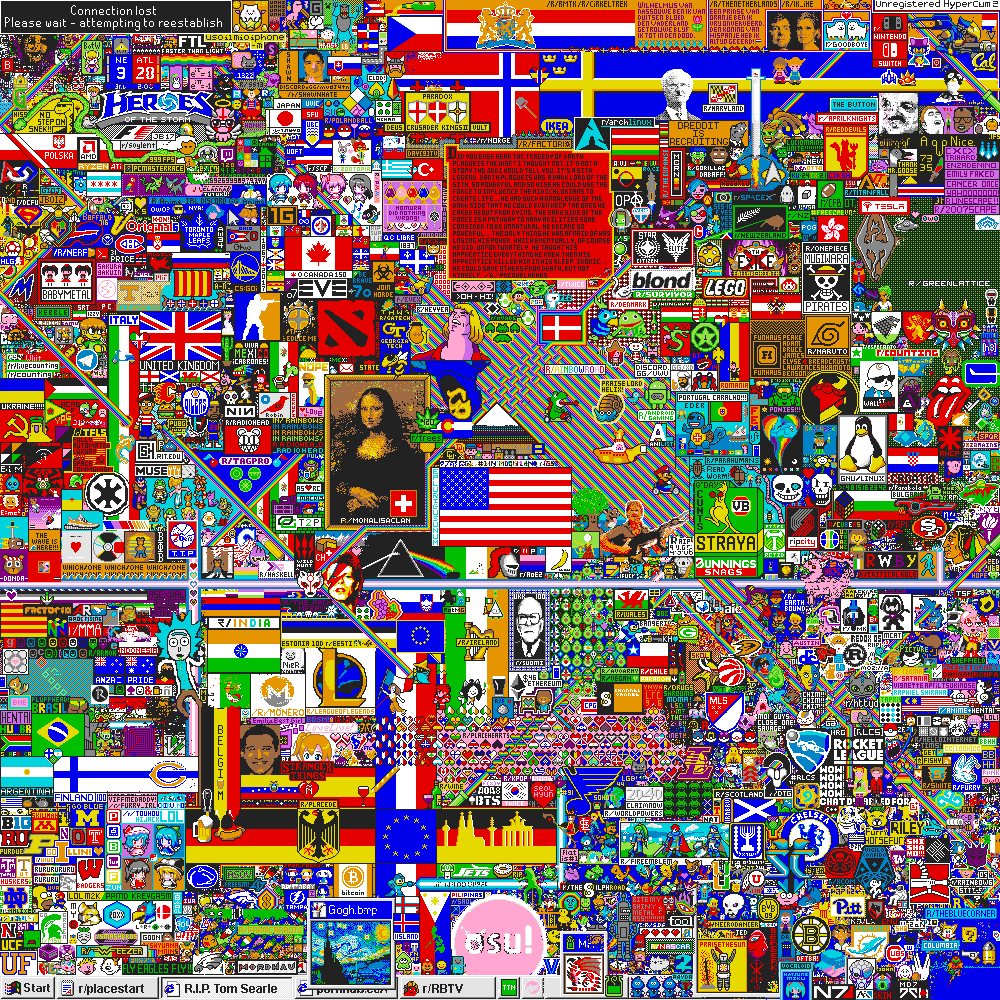
The last viable state of the r/place canvas. For 2017, it's what was left after the end of the event. For 2022, it's what existed right before Reddit turned off every tile color except for white. These are also visible in the zoomable images linked above.
- 2017 Final Image
- 2022 Final Image (This is just a copy of the image Reddit released; the errors in the official dataset mean that any final image I make will be incorrect.)
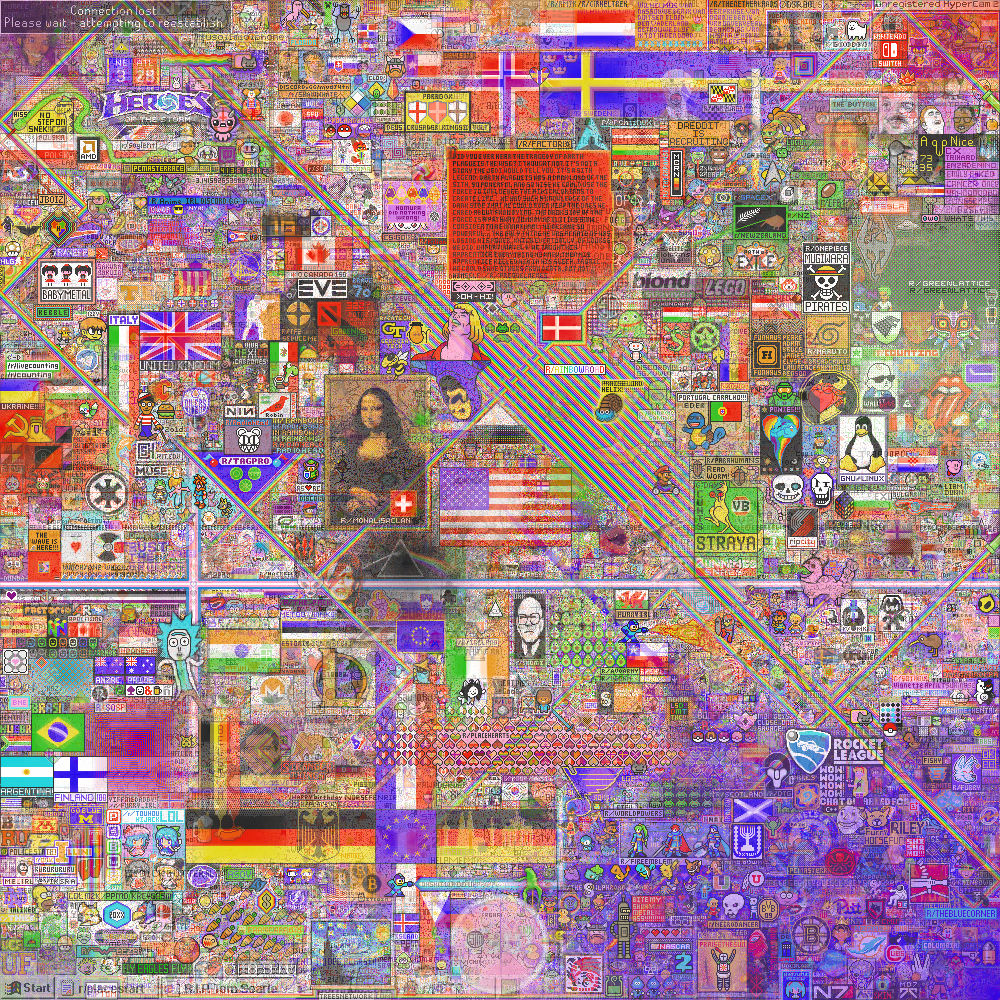
A composition of the each pixel's average color over the course of the event (also visible in the zoomable map above). "Average" is the mean of pixel colors in CIE L*a*b* space, weighted by the amount of time the pixel spent at each color. I really like this view; you can see the palimpsest nature of the canvas.
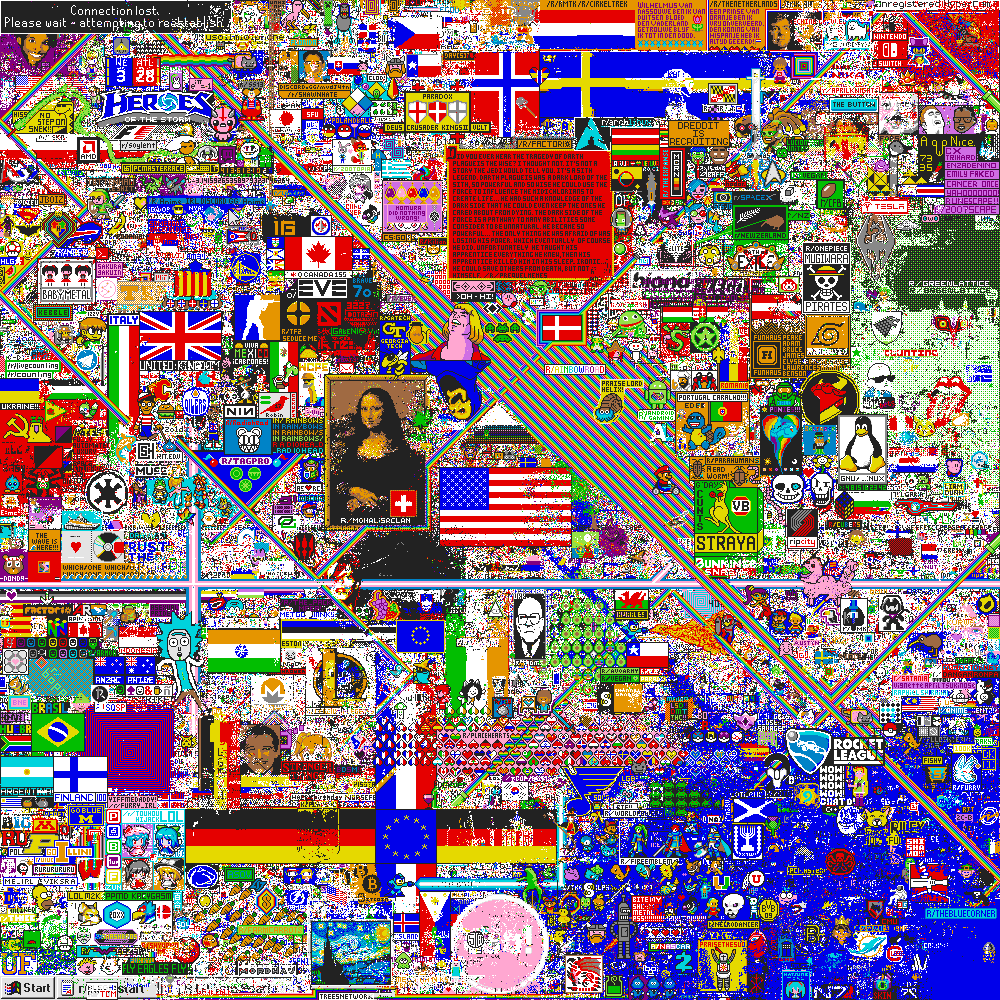
The most and second-most common colors for each pixel.
Data
2022
Official data has been shared in a post on r/place. Unfortunately, there appears to be data missing from the official dataset. The download links appear to be disabled now, so here's my copy of the data, flawed as it is:
- The 2022 tile placement data (xz-compressed CSV, 7GB). Note that the file is not in chronological order
- In case it's useful, I also have
a smaller protobuf dataset
(3.3GB) with the placements in chronological order and all
moderator actions expanded into a series of individual tile
placements. You'll also need
the accompanying
.protofile to be able to decode it.
The fields in the 2022 CSV from Reddit are timestamp, user_id, pixel_color, and coordinate, with the following meanings:
- timestamp
- An ISO 8601–formatted time in UTC with millisecond precision giving the time the tile was placed.
- user_id
- A base64-encoded SHA-512 hash of an identifier representing the Reddit account that placed the tile. The identifier is not the account name; it's an internal identifier that was probably only used for r/place. Reddit does not want third parties to be able to connect specific tile placements to Reddit accounts in any way.
- color
- The color of the tile placed, as a standard hex triplet.
- coordinate
-
A string giving the coordinates of the tile. Most of these are
comma-delimited lists of two numbers,
e.g.
"826,1048". Those give the x and y coordinates of the tile. Some strings have four numbers, e.g."1349,1719,1424,1752". Those represent use of a Reddit moderation tool to change an entire rectangle at once. The four numbers may be read as "x1,y1,x2,y2", where "x1,y1" is the upper left corner of the rectangle and "x2,y2" is the lower right corner of the rectangle. (The interval is closed; the rectangle includes both "x1,y1" and "x2,y2".)
A few people collected data unofficially during the event:
The dataset from u/opl_ is pretty extensive. It includes a number of details that are absent from the official data. It's also missing some data and some of the formatting is incorrect. That's to be expected, of course, since no one was able to predict the mechanism by which r/place would be operating, and the canvas and palette expansions were a complete surprise.
Alex Tsernoh's dataset is a little simpler. It's just a set of canvas images captured at intervals during the event. As with u/opl_'s dataset, it's missing some data from the beginning of the event and the start of the first canvas expansion.
2017
Reddit shared official data on pixel placements in a post on April 18, 2017. Some of the links there have already begun to rot. Just to have another source of data, here are my mirrors:
- The original full dataset (xz-compressed CSV). The fields are: timestamp, username hash, x, y, color.
- An updated full dataset (xz-compressed CSV). At some point—I don't know when—the data linked from the Reddit post was changed. The timestamp format was changed, the username hashes were changed, and possibly some pixel placements were added or removed.
The datasets are about 180 MB each, compressed with xz. The original and updated datasets decompress to 800 MB and 1 GB CSV files, respectively. The original dataset contains 16,559,897 pixel placements. The updated dataset contains 16,567,567.
The timestamps in the original dataset appear to be epoch milliseconds, although with only a one-second granularity. The timestamps in the updated dataset are in ISO 8601 format with actual millisecond resolution.
The username hashes in the original dataset were obtained by taking each Reddit username, calculating its SHA-1 digest, and then encoding the digest with Base64. This meant that you could get pixel placements for a particular person if you knew their username, but you couldn't look at a particular pixel and figure out which Reddit user placed it. The hashes in the updated dataset appear to be different, but I'm not sure how they were derived.